

0030//Statistical Confidence Interval Mean and Variance of Inspection
- Mar 3, 2016
- 3 min read

Confidence Interval is a statistical jargon often use by "industrial statistician" to present the confidence level of their data collection.
However, not all the audience (sometime the presenter) really understand what its mean! Therefore, in this post, we will discuss about the basic concept behind it and how to calculate it.
Note: In this post, we only cover single population's confidence interval. Hypothesis Testing's confidence interval will cover in future post.
Basic:
In a machining shop, the QA engineer sampling inspected 6 pcs machined shaft out of N pcs of shafts and the measurement result shown as below:
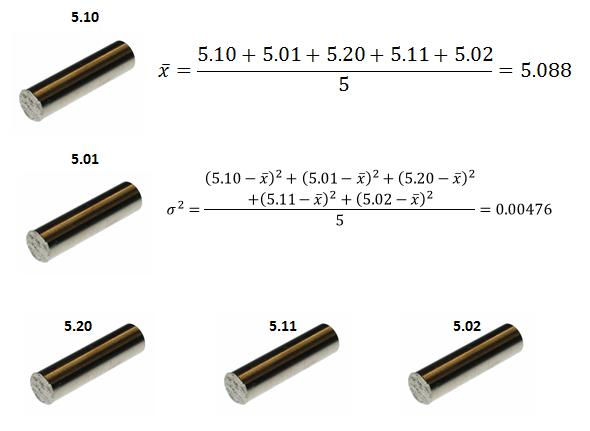
In the second trial, QA engineer sampling inspected another 6 pcs machined shaft out of N pcs of shaft again and the measurement result shown as below:

In the third trial, QA engineer inspected another 6 pcs machined shaft out of N pcs of shaft again and the measurement result shown as below:

From these three sampling, QA engineer realize the mean and variance for these three sampling are differents. So, what is the mean and variance for the entire population (lots) ?
In engineering maths, these mean and variance known as point estimation of parameters. As the number of shaft QA engineer inspected increase, the more reliable the data we can get. (this phenomenon can calculate by confidence interval for mean of the normal distribution with unknown variance. )
Based on the QA engineer inspection, we have two set of variables:

So, by mapping mean and variance sets to Student's t-distribution and Chi-squared distribution, we can get confidence level limits when confidence level specified.
Calculation for confidence interval for mean of the normal distribution with known variance
Step 1: Choose confidence level (95%, 99%, ...)
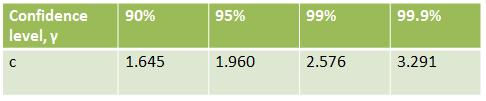
Step 2: Determine the corresponding c,
Step 3: Compute the mean (point estimation) of the sample
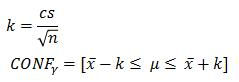
Step 4: Compute constant by formula and get the confidence interval as below:

Calculation for confidence interval for mean of the normal distribution with unknown variance
Step 1: Choose confidence level (95%, 99%, ...)
Step 2: Determine the solution c of the equation,

from the Student's t-distribution table with n-1 degree of freedom (note: n = sampling size)

Step 3: Compute the mean and variance (point estimation) of the sample
Step 4: Compute constant by formula and get the confidence interval as below:
Calculation for confidence interval for variance of the normal distribution without mean
Step 1: Choose confidence level (95%, 99%, ...)
Step 2: Determine the solution c_1 and c_2 of the equation,

from the table of Chi-square distribution with n-1 degree of freedom (note: n = sampling size)

Step 3: Compute constant by formula and get the confidence interval as below:

Practical Example by using excel:
Assume I sampling inspected 50 pcs of shaft's OD with calliper and below shown the measurement:

using excel formula, =CONFIDENCE.NORM(alpha,standard deviation,sample size)
where
alpha = 1- confidence level
standard deviation = square root of variance of my sample (point estimation)
sample size = number of shaft
How to interprete value return by this formula? Actually, this formula return value is k. So, confidence interval as shown as below:

So, I know my confident lower and upper limit are (102.56-0.51) and (102.56+0.51) respectively.
However, I still figuring how to use Excel to solve confidence level for variance without using complicated formulae. Maybe I will include this in the future post. =P
return 0;


Comments